Navigating the dashboard
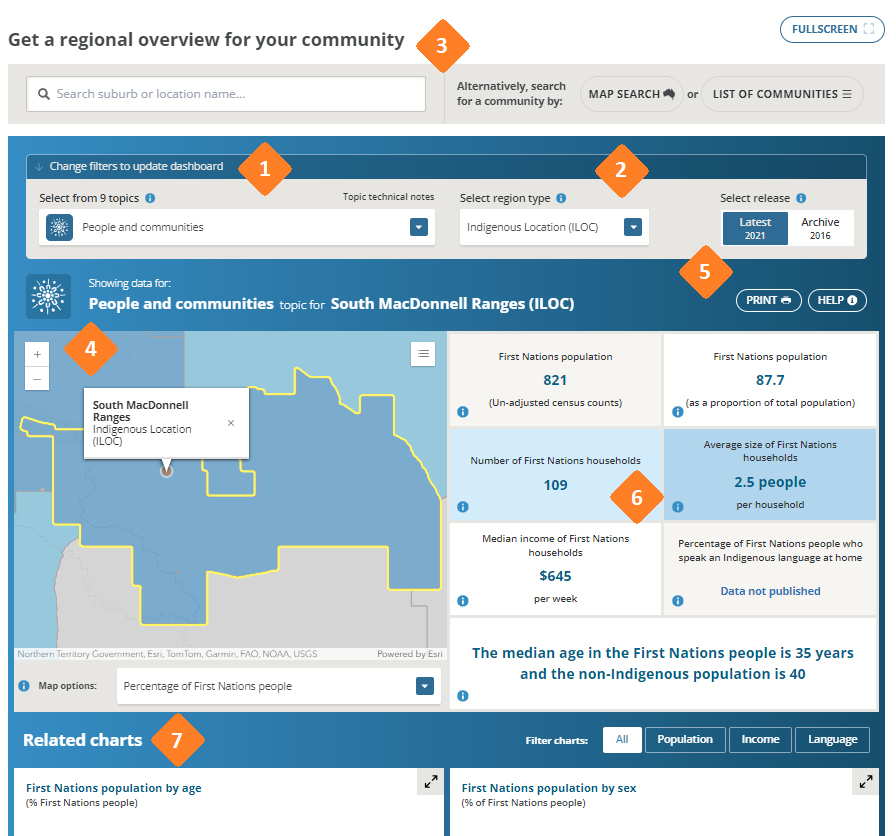
1. Start here
Select the topic of interest.
2. Select region type
Select region type that you would like to view data by.
3. Search for a community
Use the bar to search for a community – or navigate using the map.
4. Map functions
Use the + and – buttons to zoom in or out. Click on the legend button to see legend. You can click on another region in the map to change the dashboard data.
5. Select dashboard functions to:
- Select release: View previously released data
- PRINT: Print the dashboard, or save as a pdf
- HELP: Toggle the dashboard tour.
6. Dashboard tiles
This part of the dashboard shows data based on the topic and region type selected from the dropdown menus. It is important to note that the statistics are about the whole region and not just the community or location you may have searched for. Hold mouse over (i) to see data source.
7. Related charts
This part of the dashboard shows data visualisations for the selected topic and region type (from dropdown menus described above).
For more detailed help and explanations, see the User guide.
User guide
The user guide below will assist you to use the RIFIC website. It covers each of the dashboards in the website and includes information on:
- how to use and access each of the resources,
- what all of the sections and buttons can do,
- examples of how to find the type of information you are interested in, with steps.
RIFIC User Guide_July 2024
PDF, 6 MB
Frequently asked questions
You can find information about an Indigenous community location by visiting the Regional overview page. Here you can search for a community (or other location) by name, and view statistics about a region that community is in.
For information on how to navigate the regional over page and regional dashboard, please refer to the user guide and videos above.
The search function uses the names of the Australian Government Indigenous Programs & Policy Locations (AGIL) 2019 Indigenous community locations, ABS State Suburbs 2016 and ABS Indigenous locations (ILOCs) 2016. The local names of some places or regions may no be the same as the names on the AGIL dataset.
If you are having trouble searching for the community you are looking for, please let us know via the Contact form. Alternatively, please send an email to us at RIFIC@aihw.gov.au.
The Regional Overview Dashboard allows you to search for, and view statistics about, the region a community (or other location) is located in. Data presented in the Regional Overview Dashboard, have been made available to the lowest level of geography possible and vary depending on data source. This is why some of the topics are only available down to certain levels of geography.
For more information about data availability by level of geography and data source, please visit the Data availability page.
This report uses data from a range of data sources, for more information on the data sources used throughout the RIFIC website head to:
Data on the website will be updated periodically when new data becomes available. Refer to the RIFIC Updates page to learn more about when website updates have been released.
Data may be unpublished or unavailable because suppression rules have been applied to the data, or because data was not available for the selected region type. Data availability and suppression rules vary by Topic and Life stage, as well as data source.
For more information about data availability by level of geography and data source, please visit the Data availability page. More information on suppression rules is available at the Technical notes page.
The data presented in the dashboards is currently not available to export or download as a data table. However, you can click the ‘PRINT’ button and save a copy of the dashboard with its current topic/region selections as a pdf.
If you are interested in requesting data tables for a particular community or location please contact us via the Contact form or at RIFIC@aihw.gov.au.
The dashboards have been developed using programs called ESRI. You can interact with these to see the specific data you are interested in. If the mouse pointer is placed over the graph, map or figure to it will change to a hand selector. A tooltip (pop-up text box) may appear to display the underlying data.
A list of the acronyms and abbreviations use throughout the website is available at the Abbreviations page.
Definitions and explanations for the technical language and terms used throughout the website is available at the Glossary page. If there are terms used that have been used, and you can’t find them in the glossary list, please let us know via the Contact form.
If you require data not currently available, please:
and we will contact you.
Should you wish to request additional data, the AIHW may charge for data requests at an hourly rate on a cost-recovery basis.
Most information released by AIHW is made available under a Creative Commons BY 4.0 licence. Head to the copyright at AIHW page for more information.
The User guide and additional information available on this Help page. If you cannot find the help you are looking for, please use the contact us page with details of support required. The AIHW RIFIC team can provide tailored support and guidance.
There are a number of videos, user guides, and additional information available on this help page. If you cannot find the help you are looking for, please use the contact us page with details of support required. The AIHW RIFIC team can provide tailored support and guidance.
We need feedback about the website. If you have anything you would like to tell us about, please use the Feedback tab at the right hand side of the website.
Other helpful links
- If you are not sure what you are looking for and would like to explore the information available, head to the Sitemap.
- For details on the modules of data available head to Data availability.
- For explanations of terminology and technical language, head to Glossary and Abbreviations.
- For further information about the data used, head to Data sources and Technical notes.
Data requests
If you still can't find the data you are interested in, or if you have further questions, you can contact us here.
Alternatively, the Australian Institute of Health and Welfare (AIHW) offers a customised data request service for access to statistics that are not available in published reports, tables, dynamic data displays or data cubes.
This service enables you to request data tables at new and various levels of disaggregation using different or derived data items. Use the web form on the AIHW website to make your request. Note that customised data requests are generally free but in rare situations, such as exceptionally large or complex requests, charges may be discussed.
Click here to request customised data.